While you may follow the various stock indexes on the nightly business news, how much do you know about their histories, how they work, and why they’re important? We pulled together some information and interesting facts about some of the major indexes that can help you put the numbers you hear in context.
Stock market indexes combine groups of stocks based on various criteria and compute their value in one calculation, helping financial professionals and individual investors track Wall Street’s performance.
Broad stock market indexes trace their origins back to May 26, 1896, when Charles Dow and Edward Jones, the co-founders of Dow Jones & Company, published the Dow Jones Industrial Average (DJIA) in The Wall Street Journal. Their goal was to quantify the daily price movements of stocks and provide a reliable measure of the stock market’s performance. Little did they know that over the following 129 years, their pioneering index would help shape how the public views and invests in the market.1
Originally composed of 12 companies, the DJIA looked to reflect the major sectors of the late 19th-century American economy. In time, the DJIA itself would evolve, and the concept of stock indexes would grow in number, size, and importance.1
Today, many people focus on three main indexes: the DJIA, the Standard & Poor’s 500 (S&P 500) composite index, and the Nasdaq Composite. These indexes provide a broader and more nuanced measure of the stocks and have become an integral part of financial markets, impacting investment strategies and providing crucial performance benchmarks.
Understanding Points vs. Percentage Moves
You’ve probably seen headlines about the market “dropping 500 points” or “soaring 800 points.” While those headlines grab attention, they don’t always tell the whole story. Today’s indexes have grown so much over time that a 500-point move means something very different than it did decades ago. For example, a 500-point drop when the Dow was at 10,000 would have been a 5% decline. Today, with the Dow around 40,000, the same 500-point drop is barely over 1%.
It’s not the number of points that matters—it’s the percentage change. This perspective can help you put market moves in a better perspective. Financial headlines are designed to grab attention, but focusing on the percentage movement can be a better measure of the market’s true volatility.
Now, before we go further, a quick disclaimer: The Dow Jones Industrial Average is an unmanaged index generally considered representative of large-capitalization companies on the U.S. stock market. The S&P 500 Composite Index is an unmanaged index that is considered representative of the overall U.S. stock market. The Nasdaq Composite is an index of the common stocks and similar securities listed on the Nasdaq stock market and considered a broad indicator of the performance of stocks of technology and growth companies. Index performance is not indicative of the past performance of a particular investment. Past performance does not guarantee future results. Individuals cannot invest directly in an index. The return and principal value of stock prices will fluctuate as market conditions change. And shares, when sold, may be worth more or less than their original cost.
Now, back to the blog.
The Dow Jones Industrial Average
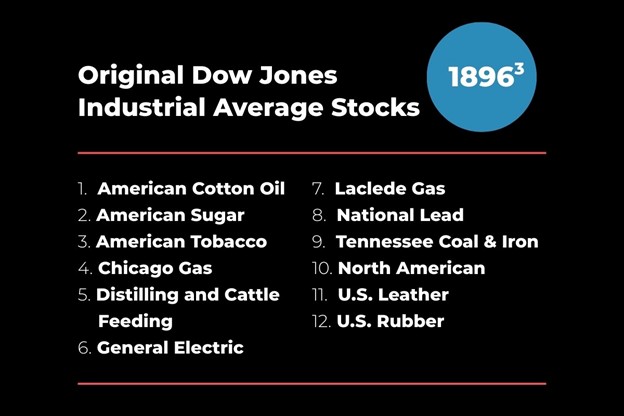
When Dow created his index in the late 19th century, he picked 12 stocks representing important industries like agriculture, coal, oil, and steel. The calculation was simple: they added the daily prices of those 12 stocks and divided them by 12. The result was the average that the index tracked. The DJIA remains a price-weighted index as opposed to some others, which are weighted by market capitalization. With a market-cap index, the companies with the most value have the most impact on the index.2
Looking at the original 12 DJIA stocks provides a fascinating glimpse into the more agrarian and burgeoning industrial nature of the U.S. economy at the turn of the last century.
Since its inception, the DJIA has undergone significant evolution, adapting to the changing landscape of the American economy and, therefore, remaining relevant to investors and market analysts today.
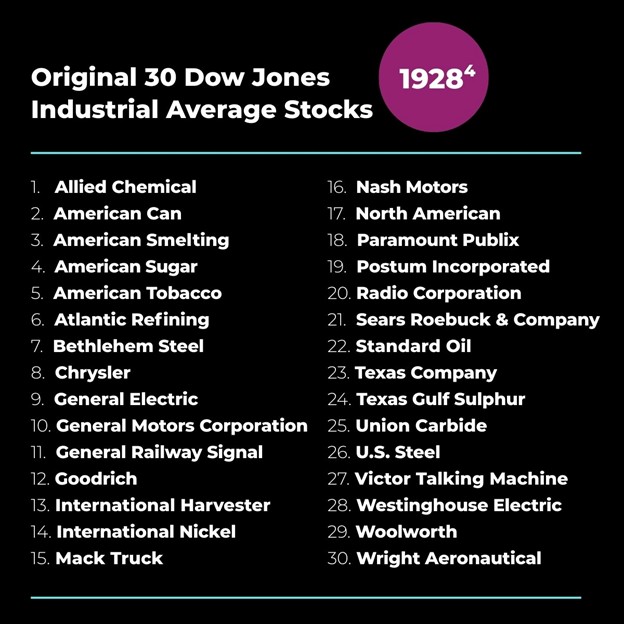
In 1916, the number of stocks represented by the DJIA increased to 20 and remained at that level until moving up to its current 30-count in 1928 to reflect the (soon-to-end) economic boom of the Roaring 1920s.
The transformation of the companies in the DJIA reflects the broader shifts and developments in the U.S. economy and stock market over time. DJIA’s continued ability to adapt has made it more than just a measure of stock prices but a barometer of economic health and investor sentiment.
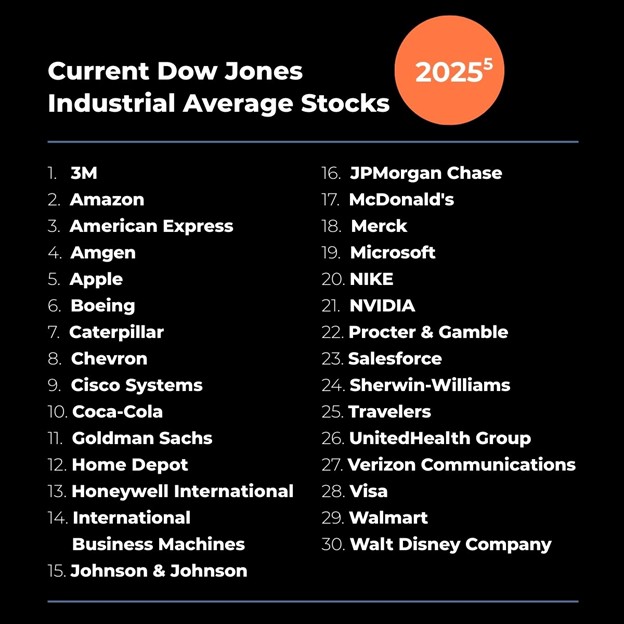
Today’s DJIA looks completely different from what it was in 1928. None of the storied names of the past are still included, acknowledging the shift away from a U.S. economy dominated by manufacturing and heavy industry to one more diversified into services and technology.
Remember: The companies mentioned are for illustrative purposes only. It should not be considered a solicitation for the purchase or sale of the securities. Any investment should be consistent with your objectives, time frame, and risk tolerance.
Interesting DJIA Facts


The S&P 500
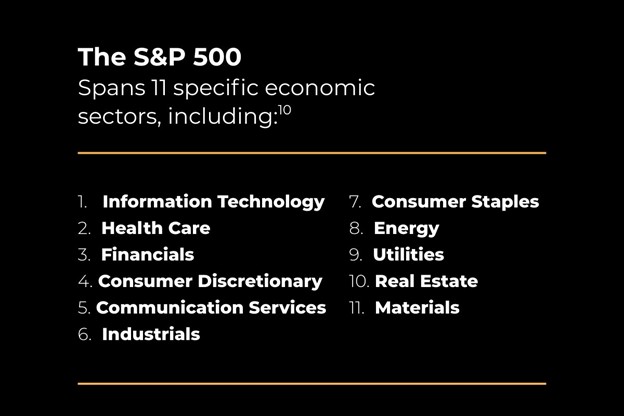
Next to the DJIA, the S&P 500 is probably the most well-known U.S. stock market index. It is broader based than the DJIA, consisting of 500 of some of the largest U.S. public companies. Because of its wide array of large companies, the S&P 500 is considered by many to be a better proxy for the entire stock market than the DJIA.
Created by Standard & Poor’s, the S&P 500 was updated to include 500 stocks in 1957. The new index took a while to catch on with investors. Its reputation as a proxy for the U.S. equity market was cemented in 1968 when the S&P 500 became one of the economic indicators used by The Conference Board to forecast economic trends.9
Unlike the price-weighted DJIA, the S&P 500 is market-cap weighted. This means that companies with a larger total market capitalization account for a higher percentage of the index’s overall value.9
To be selected for inclusion in the S&P 500, companies need to meet certain requirements, including:9
- Be based in the U.S.
- Be a corporation and offer common shares of stock
- Have a market capitalization of at least $20.5 billion
- Trade on a major U.S. exchange
- Have shares that are highly liquid
- Have positive earnings in the most recent quarter and have positive earnings when adding up the last four quarters
Over the years, the S&P 500 has become an accepted economic indicator. Many people think of it as more than just a good way to measure the strength of the stock market; they also consider it a way to evaluate the overall health of the economy.
Interesting S&P 500 Facts
Nasdaq Composite
The Nasdaq Composite is an index that includes most of the securities traded at the Nasdaq stock exchange, the world’s largest electronic stock exchange.
“Nasdaq” is short for National Association of Securities Dealers Automated Quotations. It ranks second only to the New York Stock Exchange (NYSE) in total market capitalization.14
Launched in 1971, Nasdaq became the home for many smaller companies that couldn’t meet the more stringent requirements of the NYSE. This made Nasdaq more appealing to startups and other fledgling businesses, including high-tech startups like Intel in 1971, Apple in 1980, and Google in 2004.14
The Nasdaq Composite is a capitalization-weighted index. That means the largest companies like Amazon, Microsoft, and Nvidia have more sway over the index results than some small firms.15
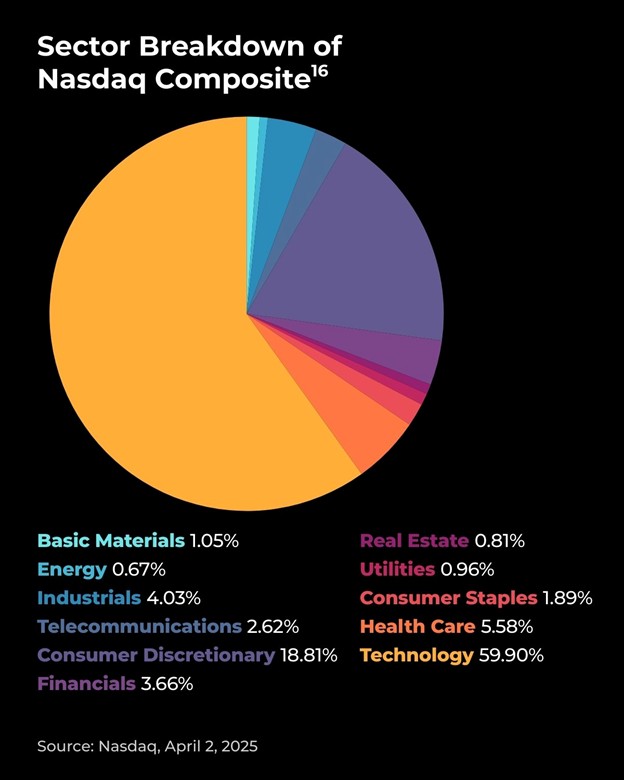
Since the Nasdaq exchange is heavily weighted with technology stocks, the Nasdaq Composite is regarded as a measure of the health of the technology sector. While tech-heavy, the Nasdaq Composite’s other largest weightings are in consumer services, health care, and industrial stocks.16
Since the Nasdaq Composite is composed mostly of growth stocks, it tends to be more volatile than the DJIA or S&P 500. That means the index can fall harder and faster during market downturns.14 That was seen in the first half of 2020, when the Nasdaq Composite led the way down as U.S. stocks tumbled into a bear market at the start of the COVID lockdowns and with the tariff-related sell-off earlier this year.
Interesting Nasdaq Composite Facts


The Importance of Indexes
We covered the three main indexes, but there are many others. For example, the Russell 2000 is an index for small-cap stocks, while the Wilshire 5000 covers almost all publicly traded companies in the U.S. Some indexes have more targeted versions of themselves, like the Nasdaq 100 or the Dow Transportation Index. There are also indexes such as the FTSE 100, which is the U.K.’s best-known stock index, and the Nikkei 225, which follows the most prominent companies on the Tokyo Stock Exchange. So, if there is a stock exchange, company size range, or sector of the economy, an index probably tracks it.20
Stock market indexes are important because they allow institutional and individual investors to track the performance of different stock market segments. While we encourage our clients to be long-term investors, we know some monitor the indexes daily. But indexes are for more than just keeping score at home.
In the past few decades, professional money management firms have created investment solutions that allow investors to buy shares in portfolios that closely mirror the performance of a certain index.
Many mutual funds and exchange-traded funds (ETFs) were created to purchase shares of all the stocks in an index at the proper weightings to closely replicate its results. Of course, the mutual fund or ETF performance will not be exactly the same as the index it tracks due to fees, expenses, and other factors.21
Stock index investing has grown into a major industry, with assets totaling more than $15 trillion.2 For a company, it’s a big deal to be included in an index. For example, when a new firm is added to the S&P 500, all the funds tracking the index must rebalance their holdings and buy the latest stock, which can boost the share price. The reverse may be true for the company that gets replaced in the index.22
An Index Is Not a Strategy
“Just buy the S&P 500” has become a common refrain in investing conversations, especially when markets are trending up. While there’s value in broad-market exposure, relying solely on an index like the S&P 500 isn’t a strategy—it’s a starting point. Indexes like the S&P only represent a narrow slice of the market, primarily large-cap U.S. companies. That means investors who go all-in on the index may unknowingly sacrifice diversification and expose themselves to more concentrated risk, especially during periods of volatility.
The Bottom Line
A well-constructed investment strategy should be aligned with your personal goals, not just market trends. Diversification, active rebalancing, and an allocation that reflects your unique time horizon and risk tolerance are key to staying on track. That’s where we come in. If you’d like to review your portfolio strategy or better understand how to balance growth with protection, we’re here to help.
Sources:
- Quantified Strategies, September 25, 2024
https://www.quantifiedstrategies.com/history-of-stock-indexes/ - Britannica Money, March 22, 2025
https://www.britannica.com/money/stock-market-index - Smart Capital Mind May 16, 2024
https://www.smartcapitalmind.com/what-were-the-original-stocks-in-the-djia.htm - Investopedia, November 6, 2024
https://www.investopedia.com/ask/answers/100214/who-were-original-dow-jones-industrial-average-djia-companies.asp - Stock Analysis, March 2025
https://stockanalysis.com/list/dow-jones-stocks/ - Investopedia November 7, 2024
https://www.investopedia.com/articles/investing/113015/4-famous-companies-dropped-dow-jones.asp - S&P Global, November 1, 2024
https://press.spglobal.com/2024-11-01-NVIDIA-and-Sherwin-Williams-Set-to-Join-Dow-Jones-Industrial-Average-Vistra-to-Join-Dow-Jones-Utility-Average - McGraw-Hill, November 14, 2024
https://www.mheducation.com/highered/blog/2024/11/how-the-dow-jones-industrial-average-works.html - Business Insider, March 27, 2025
https://www.businessinsider.com/personal-finance/investing/what-is-the-sp-500 - SoFi, February 25, 2025
https://www.sofi.com/learn/content/sp-500-sectors/ - Topforeignstocks.com, March 30, 2025
https://topforeignstocks.com/indices/components-of-the-sp-500-index/ - Quantified Strategies, April 8, 2024
https://www.quantifiedstrategies.com/how-many-companies-have-ever-been-in-the-sp-500-index/ - Investopedia, April 13, 2023
https://www.investopedia.com/ask/answers/041015/what-history-sp-500.asp#citation-18 - Business Insider, July 18, 2024
https://www.businessinsider.com/personal-finance/investing/what-is-nasdaq - Biztech, February 17, 2025
https://biztechcommunity.com/stocks-trading/what-is-the-nasdaq-composite/ - Nasdaq, April 2, 2025
https://indexes.nasdaqomx.com/Index/Breakdown/COMP - Statista, March 10, 2025
https://www.statista.com/topics/10014/nasdaq-stock-market/#topicOverview - FXPRIMUS, June 17, 2024
https://fxprimus.com/blog/nasdaq-composite-history-and-overview - ValueWalk, April 2, 2025
https://www.valuewalk.com/investing/nasdaq-stock-exchange/ - Liberated Stock Trader, August 13, 2024
https://www.liberatedstocktrader.com/stock-market-indices-explained/ - Mutual funds and exchange traded funds are sold only by prospectus. Please consider the charges, risks, expenses, and investment objectives carefully before investing. A prospectus containing this and other information about the investment company can be obtained from your financial professional. Read it carefully before you invest or send money.
Exchange-traded funds (ETFs) are subject to the market and the risks of their underlying securities. Some ETFs may involve international risks, which include differences in financial reporting standards, currency exchange rates, political risks unique to specific countries, foreign taxes and regulations, and the potential for illiquid markets. These factors may result in greater share price volatility. Furthermore, ETFs that focus on a small universe of securities may be subject to more market volatility, as well as the specific risks that accompany the relevant sector, region, or group. An ETF’s trading price may be at a premium or discount to the underlying securities’ net asset value (NAV). - Bankrate, March 27, 2024
https://www.bankrate.com/investing/what-is-sp-500/
The content is developed from sources believed to be providing accurate information. The information in this material is not intended as tax or legal advice. It may not be used for the purpose of avoiding any federal tax penalties. Please consult legal or tax professionals for specific information regarding your individual situation. This material was developed and produced by FMG Suite to provide information on a topic that may be of interest. FMG Suite is not affiliated with the named broker-dealer, state- or SEC-registered investment advisory firm. The opinions expressed and material provided are for general information, and should not be considered a solicitation for the purchase or sale of any security. Copyright FMG Suite.